Probability Portfolio
For this project, we had to explore the different types of probability via problems we were assigned in class.
The main mathematical ideas were experimental and theoretical probability. Experimental probability is a probability based on the amount on number of the favorable outcome to the total number of trials. Theoretical probability is a probability that a certain outcome will occur, as determined through reasoning and/or calculations. We learned about these ideas via assignments that let us apply these theories.
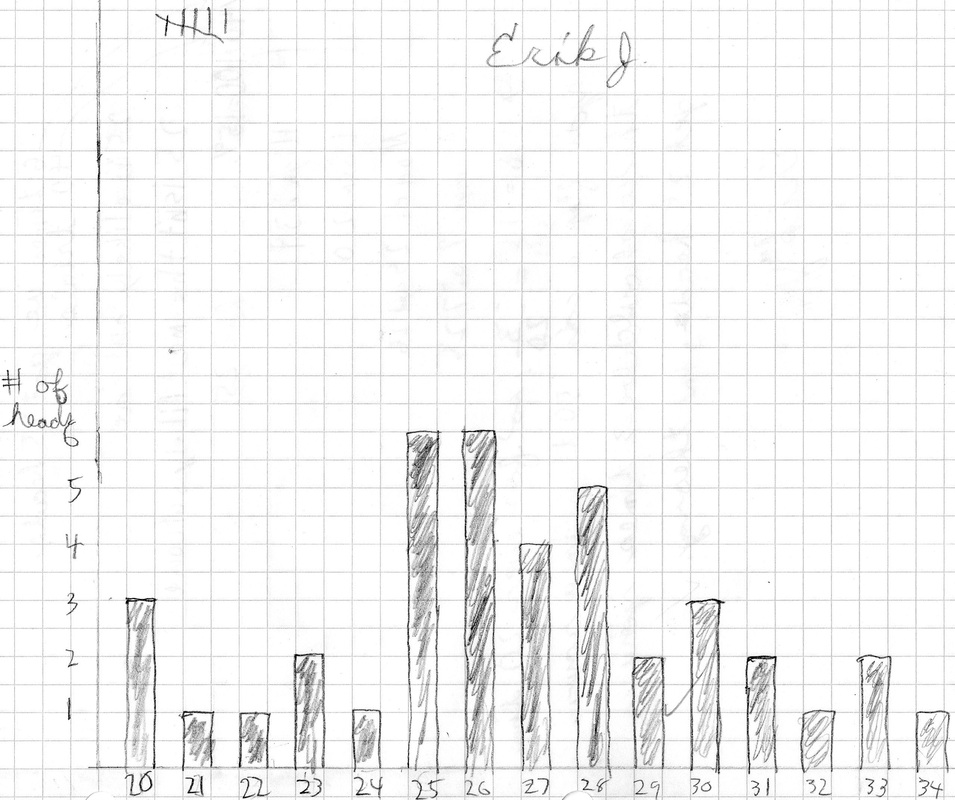
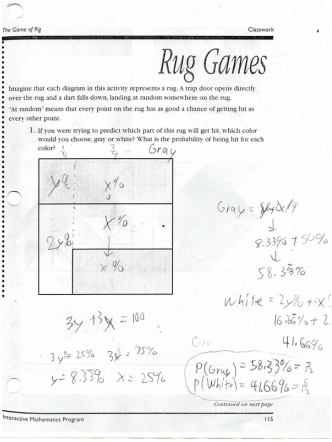
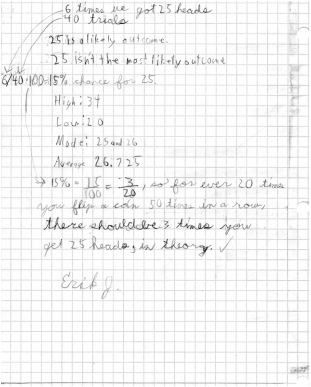
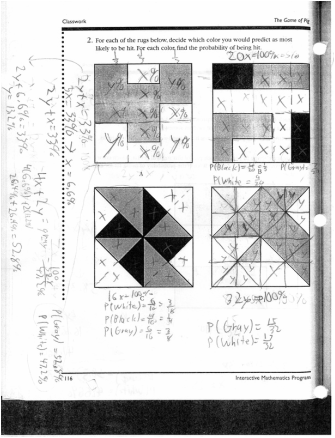
One of the ways we learned about theoretical probability via the rug problem. The rug problem let us makes educated guesses were a dart would fall on a rug with varying amounts of colors. We would make these guesses based off of ratios between the colors on the rug the total amount of rug there was. This helped us first explore theoretical probability. We explored experimental probability via a problem involving flipping a penny many, many times and using the data we recorded to make educated guesses on how many times we’d get heads in the future. This helped us work with experimental probability.
I feel that now, whenever I’ll encounter a situation involving probability, I’ll approach it differently. If I have choices, like at a, I can assess my choices, and choose the one of least theoretical risk. For example, I could base a board game strategy for games that involve spinners, by comparing the probability of the various possibilities on the spinner. I also learned that if I’m facing an issue with probability, I can always do tests or observe the results, and see which results come up the most. An example of this is paying attention to jockey’s performance at a horse race
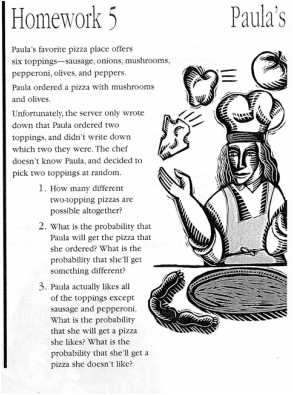
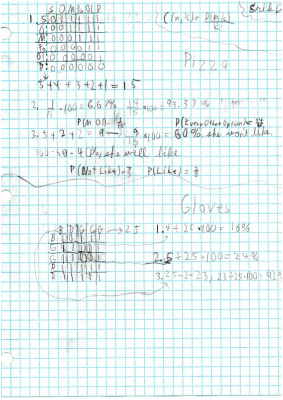
I am most proud of my work on the Paula’s Pizza. In this problem, you had to find the amount of combinations possible for two different pizza toppings. This is because I visualized the problem with a table that was great for probability. This table showed all the possible ways you could combine the different pizza ingredients. Later we needed to find the odds of getting specific topping. The table then came in handy again. So, as you can see, I am proud of this problem since I was able to visualize probability.
One habit of a mathematician I used during these projects was to visualize. I used the visualization when I made the aforementioned table for Paula’s Pizza. Another way I visualized was by spitting up the different colors in the rug problem. I made sure to draw visualize dividers so that I could compare the amount of color to the total amount of rug. I also made sure to stay organized, another habit of a mathematician. I kept all my work in the math section of my binder, making it easy to return to my work at the beginning of class. I also made bar graphs that clearly expressed all the information needed. I made sure to make these organised, since it’d be clear to others if I needed to present my work.
One of the ways we learned about theoretical probability via the rug problem. The rug problem let us makes educated guesses were a dart would fall on a rug with varying amounts of colors. We would make these guesses based off of ratios between the colors on the rug the total amount of rug there was. This helped us first explore theoretical probability. We explored experimental probability via a problem involving flipping a penny many, many times and using the data we recorded to make educated guesses on how many times we’d get heads in the future. This helped us work with experimental probability.
I feel that now, whenever I’ll encounter a situation involving probability, I’ll approach it differently. If I have choices, like at a, I can assess my choices, and choose the one of least theoretical risk. For example, I could base a board game strategy for games that involve spinners, by comparing the probability of the various possibilities on the spinner. I also learned that if I’m facing an issue with probability, I can always do tests or observe the results, and see which results come up the most. An example of this is paying attention to jockey’s performance at a horse race
I am most proud of my work on the Paula’s Pizza. In this problem, you had to find the amount of combinations possible for two different pizza toppings. This is because I visualized the problem with a table that was great for probability. This table showed all the possible ways you could combine the different pizza ingredients. Later we needed to find the odds of getting specific topping. The table then came in handy again. So, as you can see, I am proud of this problem since I was able to visualize probability.
One habit of a mathematician I used during these projects was to visualize. I used the visualization when I made the aforementioned table for Paula’s Pizza. Another way I visualized was by spitting up the different colors in the rug problem. I made sure to draw visualize dividers so that I could compare the amount of color to the total amount of rug. I also made sure to stay organized, another habit of a mathematician. I kept all my work in the math section of my binder, making it easy to return to my work at the beginning of class. I also made bar graphs that clearly expressed all the information needed. I made sure to make these organised, since it’d be clear to others if I needed to present my work.
|
|
